Weather forecasters often talk about the computer models they use to help predict snow, but are they just for the pros? Not at all. Most of the data used by meteorologists are widely available online. Knowing the right models to look at can help you read between the lines of the forecast and find those blue sky days, even those with fresh powder awaiting you.
The term “weather model” is not very helpful and makes it seems like there’s a black box of wizard-like technology that somehow predicts the weather. Actually, weather models are quite simple to explain: They are computer programs. Just like Microsoft Word or your favorite video game, a weather model is made of special code that is run by a computer. In other words, a model is a computer algorithm which predicts the weather (the entire process is known as “Numerical Weather Prediction”), typically run on huge government computers, by the U.S. and other governments, or institutions such as the ECMWF
This code takes in current weather data, computes the answers to complicated physics equations and generates a weather forecast for hours, days, and weeks into the future. It’s merely a simulation of the future state of the atmosphere. And you don’t have to do the computing yourself.
You can take a big-to-small approach when looking at weather models. First, look at models that cover the globe (or a large area of it) and then look for more detailed models that cover specific geographic areas you are most interested in. It’s best to get a general idea of the weather patterns and then look for a more detailed, nuanced view.
Types of Weather Models

The most well-known large-scale models often referred to by that knowledgeable meteorologist standing in front of a “green screen” on TV are the American GFS (Global Forecast System), the European (sometimes called the ECMWF), the Canadian (sometimes called the GEM), the UKMET (from the United Kingdom) and the American Navy’s model (FNMOC). These models cover large areas and therefore are not always the most accurate when it comes to forecasting snow amounts in the high mountain peaks. The ECMWF is generally considered the most accurate, just slightly so, than the American system.
However, they do provide access to weather predictions worldwide. The most accurate model, on average, is the European model. But remember that any model can be more accurate at any time and for any specific area, so it’s often best to look at a few models and determine which models are consistent with one another and which are outliers.
Smaller-scale models don’t cover as much area, and for this reason, they can be more detailed for the areas that they do cover. The limitation is usually computer power. More detailed models need additional computer power to crunch through the additional data, so the trade-off is that these models can only cover a very specific area. The models that fall into this category are the American NAM (North American Model), the American RUC (Rapid Update Cycle), and the American HRRR (High-Resolution Rapid Refresh). While the global models often predict weather out to 15 days, these models focus more on the short-term weather. The NAM predicts out to 84 hours (3.5 days), the RUC only forecasts out to 18 hours, and the HRRR offers 12-hour predictions.
The benefit of using these short-term and highly detailed models is that they update frequently. While the global models and the NAM update every six hours, the RUC and HRRR update every hour. This is very helpful as a storm is moving in or is in progress. Of course, no weather model is perfect, so when you’re forecasting for a storm that’s close by or in progress, you should supplement the model information with current radar and satellite trends. This is called nowcasting and can be as difficult as longer-range predictions.

Reading Weather Models
Read the station models at each point of observation. If your weather map has station models, each one will plot the temperature, dew-point, wind, sea level pressure, pressure tendency, and ongoing weather with a series of symbols. Temperature is generally recorded in Celsius degrees and rainfall is recorded in millimeters.
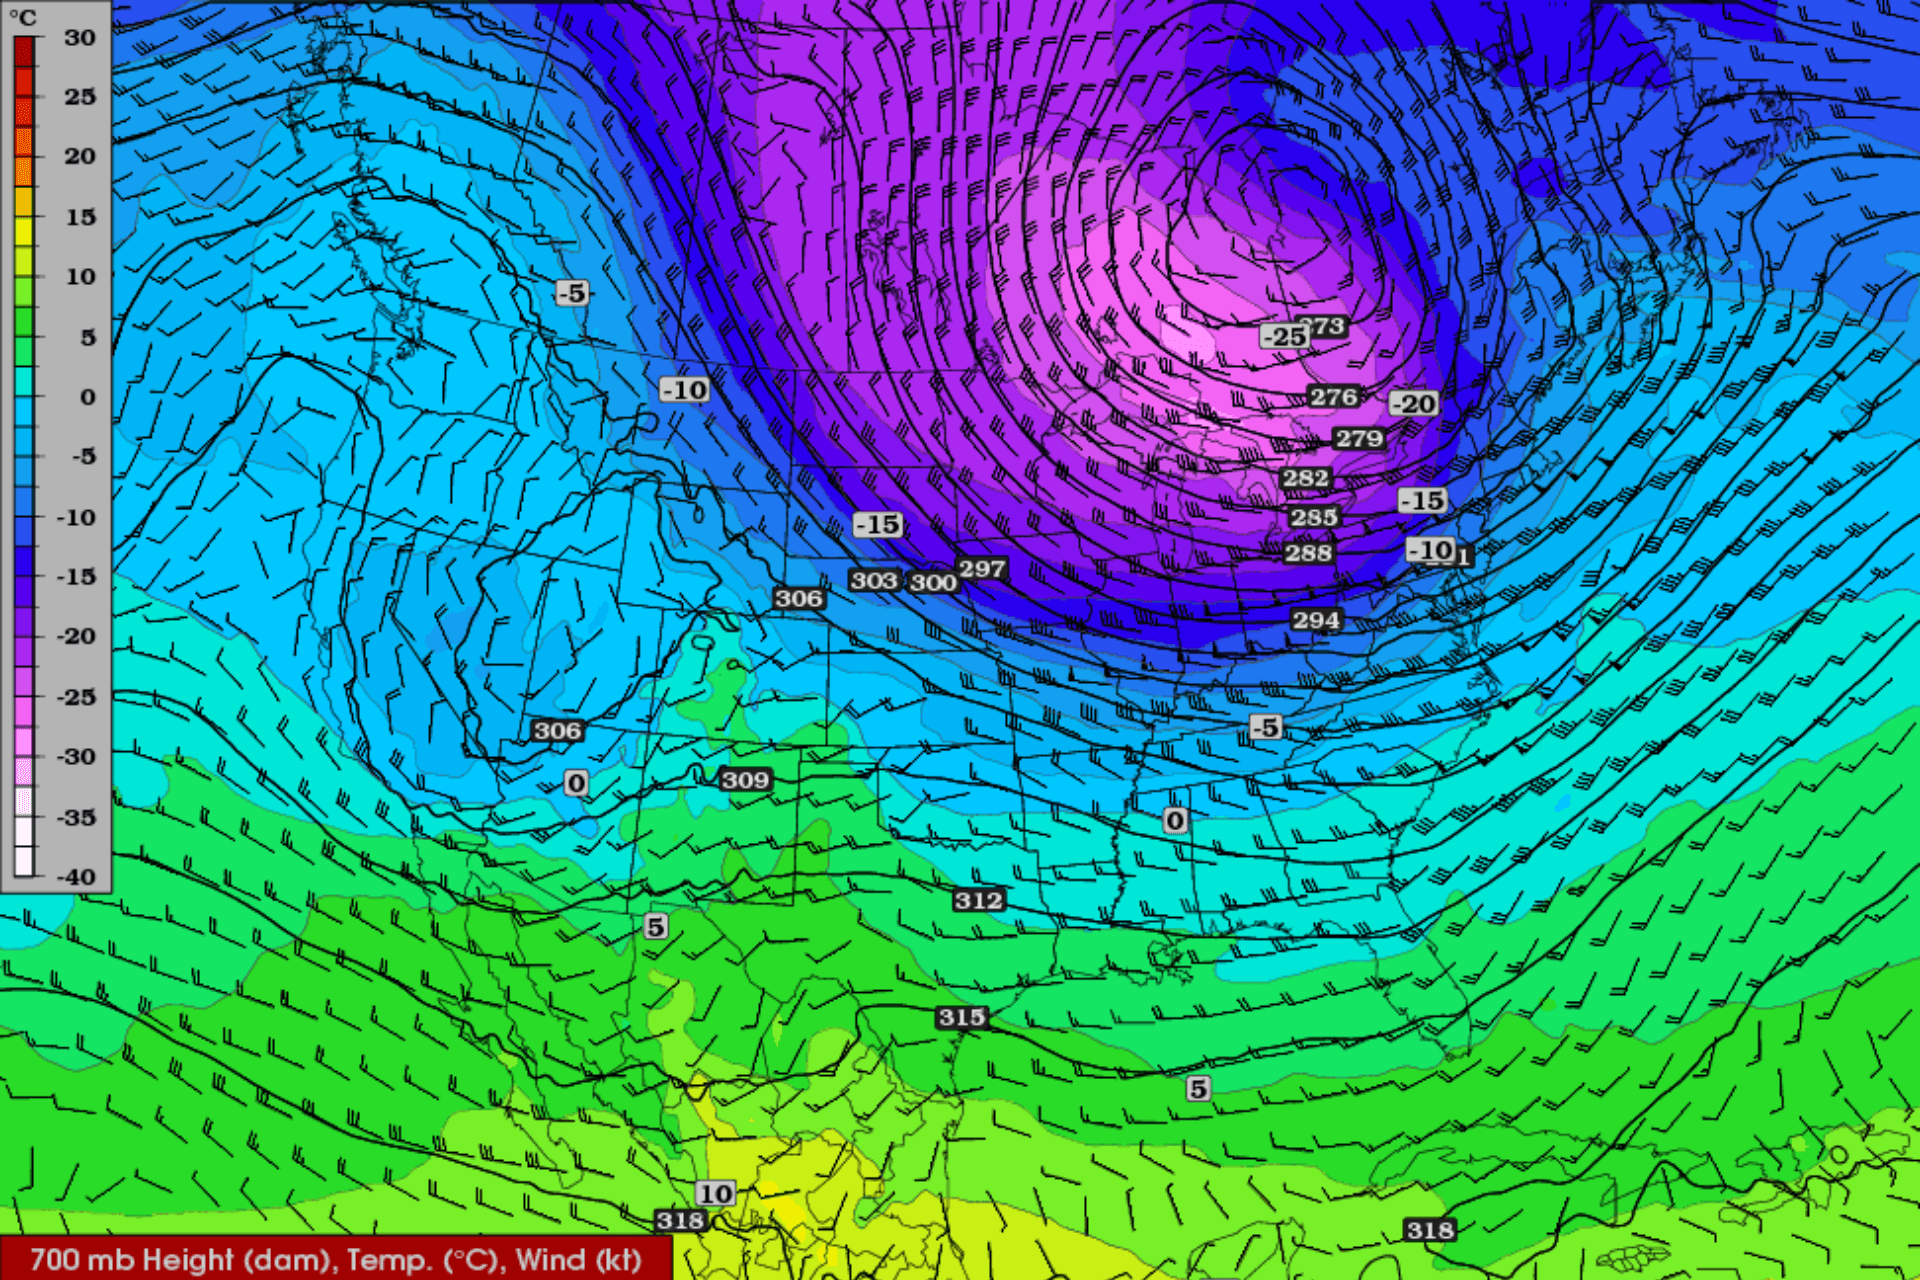
One other piece of information that will help you decipher weather models is knowing which charts to look at. Precipitation is often the preferred chart and it gets to the heart of what we skiers and riders are searching for—snow. But other maps can be helpful as well. The 700 mb map shows conditions near the mountain tops of western U.S. resorts (10,000 feet), and this is helpful in knowing temperatures, wind speed and wind direction. The 850 mb map is similar but shows conditions at about 5,000 feet in elevation, which is more representative of the higher east coast resorts. And the 500 mb vorticity map will show the location of storm energy around 18,000 feet, which helps to pinpoint areas of potentially heavier precipitation.
There are plenty of websites that provide this model data for free, so search around and find one you like. Once you start looking at the model data, you could become addicted. Go ahead and out-forecast that talking head on TV. Media.bom.gov.au offers up plenty of tips on how to read the models, mostly provided by non-meteorologists so they are easy to understand.
It is practically impossible to give you a perfectly accurate prediction of the weather. However, using a station model, meteorologists are capable of giving you a near-perfect representation of the weather, which is exceptionally essential for pilots, drivers, and many more.
Some fun facts
Are these forecasting models a relatively new thing? Yes. They came into use shortly after World War 11 (1949 to be exact). George Cowling, the BBC’s first weatherman, hopped in front of a weather map in 1954 (although it was likely a blue screen in those days). Some experiments were made in the U.S. during the war years via the DuMont Television Network. The models sure beat those old weather balloons.


